Monday, 31 December 2012

Larry Edelson: The Mayans Were Right … So fasten your seatbelts for 2013


Larry Edelson

The Mayans were right. They never predicted the end of the world on 12/21/12. Those predictions were the antics of doomsayers and others hell bent on frightening you. The Mayans predicted a turn in the major cycles impacting the world, and the beginning of a new era. And to that degree, I think they were spot on.
I say this because my work on economic cycles tells me the same thing; namely that we are now about to pass through the eye of the hurricane of what will be the biggest and nastiest financial storm of all time … and the back wall of that hurricane is about to hit in 2013.
I’ve studied the K-wave in detail … the Juglar economic cycle … the Kitchen cycle … the Kuznets cycle … and even the War cycles …
And all of them start ramping up in 2013, and will exert their influence for years to come, converging upon the economy in a way that hasn’t been seen since the period from 1841 to 1896, a period in U.S. history …
— That was characterized by 14 distinct recessions and SEVEN major financial panics.
— Included the longest and steepest depression in U.S. history, from 1873 to 1896. And …
— Where three of the ten deadliest wars in U.S. history occurred: The Civil War, the Spanish-American Wars, and U.S. Indian wars.
So fasten your seatbelts. The relative calm you’ve seen in the markets over the last 12 to 18 months is nearly over and the next phase of the financial crisis is just about here.

To read the rest of this article: http://www.uncommonwisdomdaily.com/the-mayans-were-right-15508

HAPPY NEW YEAR EVERYONE!

( h/t )
Venezuela is the best performing stock market for 2012: http://www.guardian.co.uk/business/2012/dec/31/venezuela-best-stock-market-2012?CMP=twt_gu


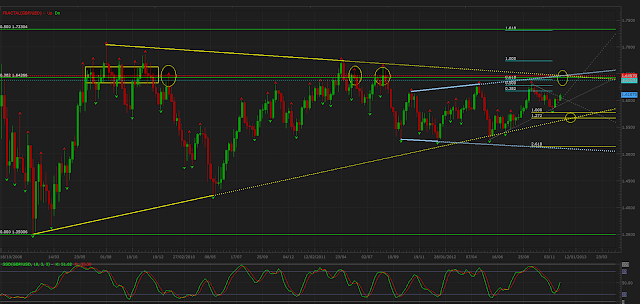
GBP/USD Weekly Technical Analysis Charts Update - December 30, 2012

Previous GBP/USD Weekly Technical Analysis Charts posted on November 06,2012: http://thescratist.blogspot.co.uk/2012/11/gbpusd-weekly-technical-analysis-chart.html 

EdMatts: EUR/USD ready to start a New Year? Because Pandora is almost ready for 1996.

Update from EdMatts November 7, 2012 post can be viewed here: http://thescratist.blogspot.co.uk/2012/11/edmatts-is-september-1996-our-guide-for.html

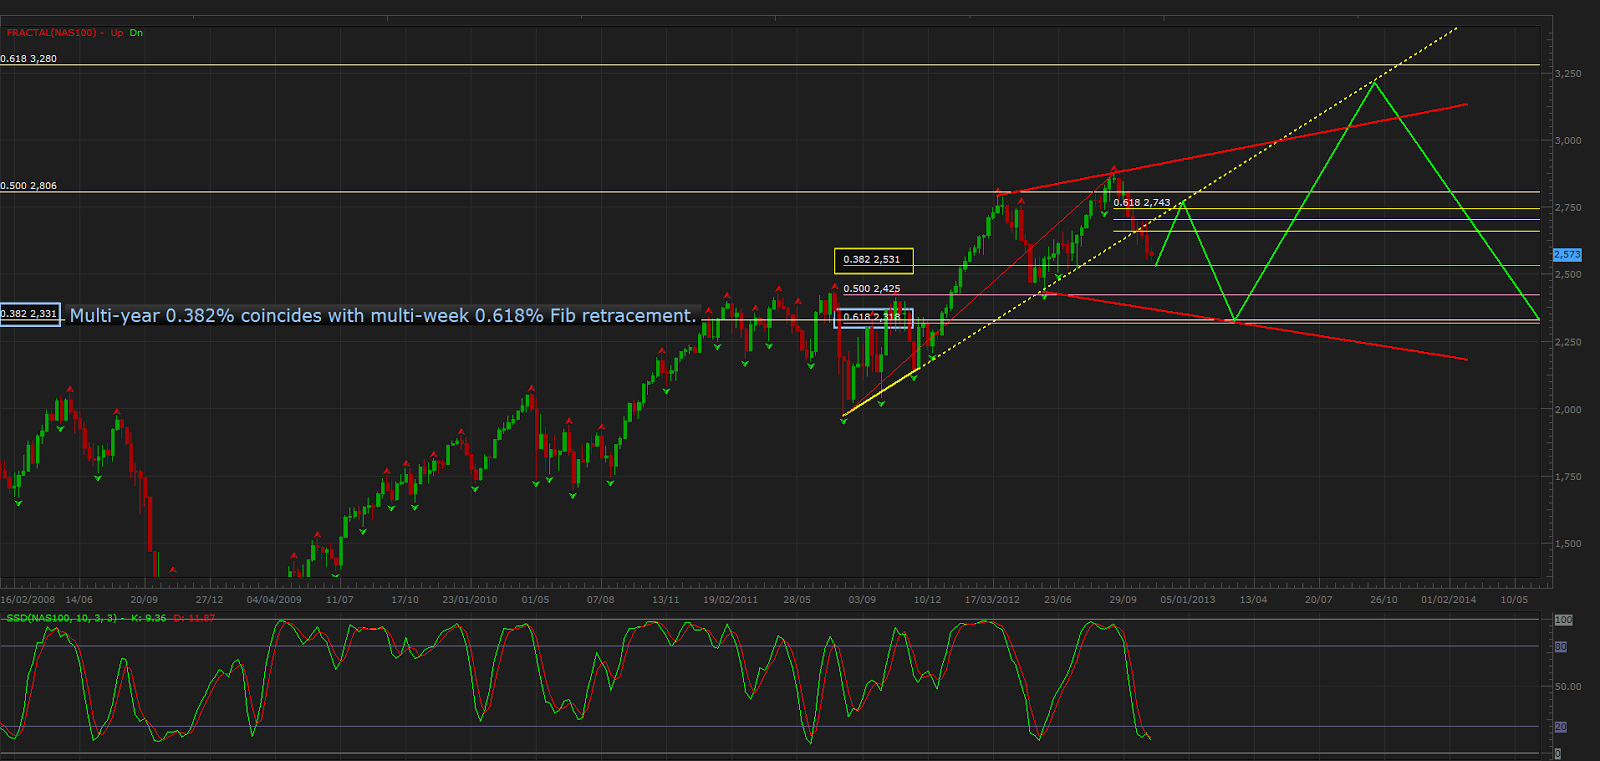
NAS100 & WTI US Crude Weekly Technical Analysis Charts Update - December 30, 2012


NAS100 Weekly Technical Analysis Chart - December 30, 2012

December 30, 2012
November 13, 2012
NAS100 TA charts posted on November 13, 2012 here: http://thescratist.blogspot.co.uk/2012/11/nas100-weekly-technical-analysis-chart.html

Sunday, 30 December 2012

The brilliant 'Self-taught' Indian mathematician Srinivasa Ramanujan Century-Old Secret Code Unlocked.

LiveScience: Now 100 years later, researchers say they've proved he was right: http://www.livescience.com/25597-ramanujans-math-theories-proved.html
THE GAINESVILLE RAMANUJAN 125 CONFERENCE on November 5-7, 2012 at the University of Florida: http://www.math.ufl.edu/~fgarvan/ramanujan125/abstracts.pdf
Krishnaswami Alladi Preface on Srinivasa Ramanujan: http://www.math.ufl.edu/~alladik/Book%20Ramanujan%20125th/ramaarticlespreface.pdf
The Lost Notebook and Other Unpublished Papers of Srinivasa Ramanujan [Hardcover] - S. Ramanujan (Author) http://www.amazon.com/Notebook-Unpublished-Papers-Srinivasa-Ramanujan/dp/1842655078

RAMANUJAN: Letters from an Indian Clerk 

A 1987 documentary for the Channel 4 'Equinox' science series: The extraordinary story of how in 1914 the self-taught maths genius SRINIVASA RAMANUJAN was brought from Madras to Trinity College, Cambridge, by the great English pure mathematician GH Hardy, who called their relationship 'the one truly romantic episode of my life'.

Wednesday, 26 December 2012

Kyle Bass: 5 Reasons Why Japanese Bond Market Will Collapse by 2016

Watch the full lecture on Americatalyst: http://www.youtube.com/watch?v=JUc8-GUC1hY&feature=youtu.be
Kyle Bass' web site: http://www.haymancapitalmanagement.com

The long-end of the Japanese yield curve is at near-record steeps...
(h/t zerohedge)

Illustrated chart article source:  http://www.zerohedge.com/news/2012-12-26/annotated-kyle-bass-short-japan-thesis


The five reasons Bass expects the Japanese government bond market to collapse are as follows: 

1. Japan has an extremely high amount of debt; it simply cannot be repaid. 
2. Interest expense on debt is very high and growing.  
3. Contrary to popular belief, Japan is NOT self-funding. The Bank of Japan will need to print more money in the years to come.  
4. Japan's demographic crisis has arrived. The country's population is declining, its taxable income is declining, savings rate are declining, and social security payments are rising.  
5. The Japanese government is at a loss for how to deal with the problem. 

Wednesday, 12 December 2012

Baltic Dry Plunges By Over 8% Overnight, Most Since 2008!

It has been a while since we looked at the Baltic Dry Index, which when normalizing for the excess glut in dry container ship supply (such as right now - 5 years after all the excess supply in the industry - has long been normalized), continues to be one of the best concurrent indicators of global shipping and trade. We look at it today, moments ago it just posted an epic 8.2% plunge, crashing from 900 to 826, or the biggest drop since 2008! Of course, conisdering the collapse in global trade confirmed in past days by both Chinese and US data, this should not come as a surprise, although we are certain it will merely bring out the BDIY apologists who tell us that supply and demand here (like in every other Fed-supported market) are completely uncorrelated.
Source ZeroHedge: http://www.zerohedge.com/news/2012-12-12/baltic-dry-plunges-over-8-overnight-most-2008

NAS100 Weekly Technical Analysis Chart - December 12, 2012

December 12, 2012
December 10, 2012

Ric Spooner: Fibonacci in practice - Educational

Nikkei225 Weekly Technical Analysis Chart - December 12, 2012


NZD/USD Technical Analysis 4hr Chart - December 12, 2012

December 12, 2012
December 06, 2012

Ashraf Laidi: FTSE’s Turn to 6000

If you’re new to this column, then you may not be familiar with our recurring fundamental and technical arguments in favour of the FTSE-100 and our insistence that it will reach the 6000 mark before the end of the year.
The arguments were laid out on November 30 http://www.cityindex.co.uk/market-analysis/market-news/2992772012/299277/, October 25 http://www.cityindex.co.uk/market-analysis/market-news/1253212012/uk-gdp-ftse-racing-to-the-bottom/ and on August 10 http://www.cityindex.co.uk/market-analysis/market-news/52792012/ftse-daily-weekly-monthly/.
Aside from the FTSE-100′s uniquely successful track record in December (rallied in each of the last nine Decembers), the index continues to show robust technicals despite having attained the feat of posting seven consecutive monthly gains.
Both weekly and monthly charts indicate a rate bullish convergence in multi-speed stochastics, while the May 2011 trendline appears on the verge of being broken. Remarkably, despite the seven straight rallying months, the Index has yet to regain its highs for the year attained in March at 5989.
The index is notorious for securing those December gains in the second half of the month. The unavoidable extension of the US Fiscal Cliff into Q2, a successful buyback program in for Greek bonds, the renewal of asset purchases by the Fed and a pro-asset purchases PM in Japan comprise the ingredients for an exogenous rally in the FTSE-100.
The four-week rally appears on its way, finally clawing its way onto the 6,000 level. And if the Golden Cross on the 55-WMA exceeding the 100-WMA is to be heeded, then 6,370 is a realistic target for late Q1.

Monday, 10 December 2012

DOW30 4hr & Daily Technical Analysis Charts.

December 6, 2012
December 7, 2012
December 10, 2012

The Daily Chart below examines the alternative probable count

December 10, 2012

Dates to know!


Silver Weekly Technical Analysis Chart: Welcome on Route 89.

If you have a wave count, it is more likely to be correct if turning points comply with Fibonnaci time intervals.


By examining previous time intervals, I can see that every time price action enters within the 89 fibonnaci timezones & starts dancing with the 55MA like a Rattle-Snake tightening its grip around a prey, Silver prices brace us with big moves up or down, usually using the 55MA as a cushion to consolidate or a launching SUPPORT pad. 
For now, I'll be looking at the 55MA for support as it coincides with a trendline & the 89 Fibonnaci time interval.
But however you look at it, Silver is preparing for it's NEXT road trip on Route 89, and it seems like it's going to be a long & slow road frustrating many.... My suggestion, stick to cruising & stop being in a hurry!

Sunday, 9 December 2012

Remember pattern is paramount, Time is confirmatory ONLY!

This post is in response to those who asked for an LIVE example of applying a Technical Analysis Pattern to trading. So here's those 4 FTSE100 cash daily charts as they unfolded. Hope this is helpful!
Chart 1
chart 2
Chart 3
Chart 4
Charts above highlight how recognizing a pattern, is paramount in applying a trading strategy offering us minimum risk/reward ratio entry points.

Saturday, 8 December 2012

Mr. Burns takes a few minutes to explain the upcoming fiscal cliff.

A Pattern Worthy Of Noticing!


This is a chart of the Nikkei225. I've started to notice this pattern of distribution & accumulation (April2004-May2005) starting to appear on the Gold Daily Chart specifically, Silver & somewhat on the NZD/USD charts.
If my observation is CORRECT, then lets move on to the opportunity presented in this pattern, and that would be a STRATEGY, that after the correction is complete, it should present us with a short consolidation period forming another pattern which will offer us a low risk/reward ratio entry point before the next big move. 


Nassim Nicholas Taleb Public Lecture at LSE (Audio): How to live in a world we don't understand.

Taleb believes that many of the best and most successful systems in the world (such as evolution) have antifragility at their heart. Conversely, those systems which reject antifragility and suppress volatility (such as modern politics and banking) become weaker and less able to withstand the inevitable shocks – the major tragedy of modernity, according to Taleb. But antifragility is not simply an antidote to “black swan events”. Taleb believes that understanding antifragility makes us less fearful in accepting the role of these events as necessary for history, technology, knowledge and everything.  
Recorded on December 05, 2012 http://www2.lse.ac.uk/newsAndMedia/videoAndAudio/channels/publicLecturesAndEvents/player.aspx?id=1680
 

Thursday, 6 December 2012

NZD/USD Technical Analysis 4hr Chart - December 06,2012

This chart is an update of the previous two charts posted in November & formless my friend,  it was!

NZD/USD Technical Analysis 4hr Chart - November 08,2012 http://thescratist.blogspot.co.uk/2012/11/nzdusd-technical-analysis-4hr-chart_8.html

NZD/USD Technical Analysis 4hr Chart - November 06,2012 http://thescratist.blogspot.co.uk/2012/11/nzdusd-technical-analysis-4hr-chart.html